|
ENGLISH |
|---|
| Home |
| Vision & mission |
| Participants |
| Maps of change |
| Contributions & forum |
| Publications |
| Utilities |
| Synthesis |
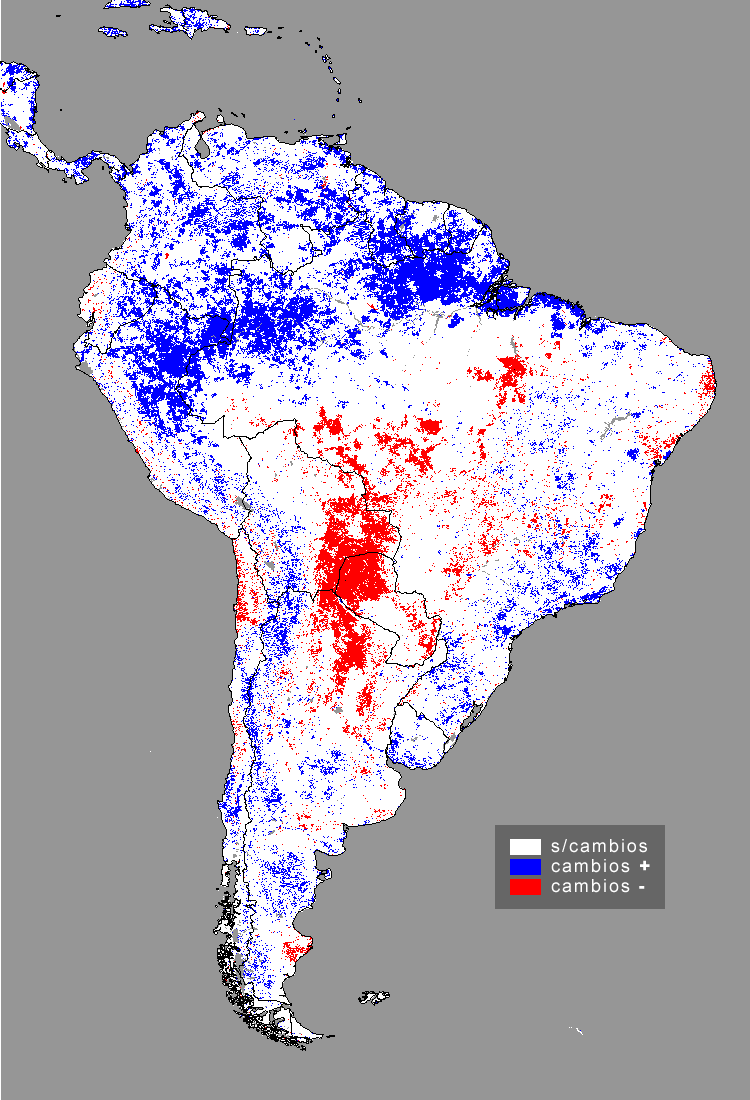
NDVI ANNUAL MINIMUM |
||||
| In this map are shown those areas that presented significant changes (p<0,10) for the annual NDVI minimum value during 1982/1999 period. In red are shown areas with minimum NDVI decrease; in blue increase; in white with no significant change. If you desire to access this image, please send an e-mail to lechusa@unsl.edu.ar. |  |
|||
 |
||||